By Rob C.
This is a long one, but important to know who’s gouging us at the pump.
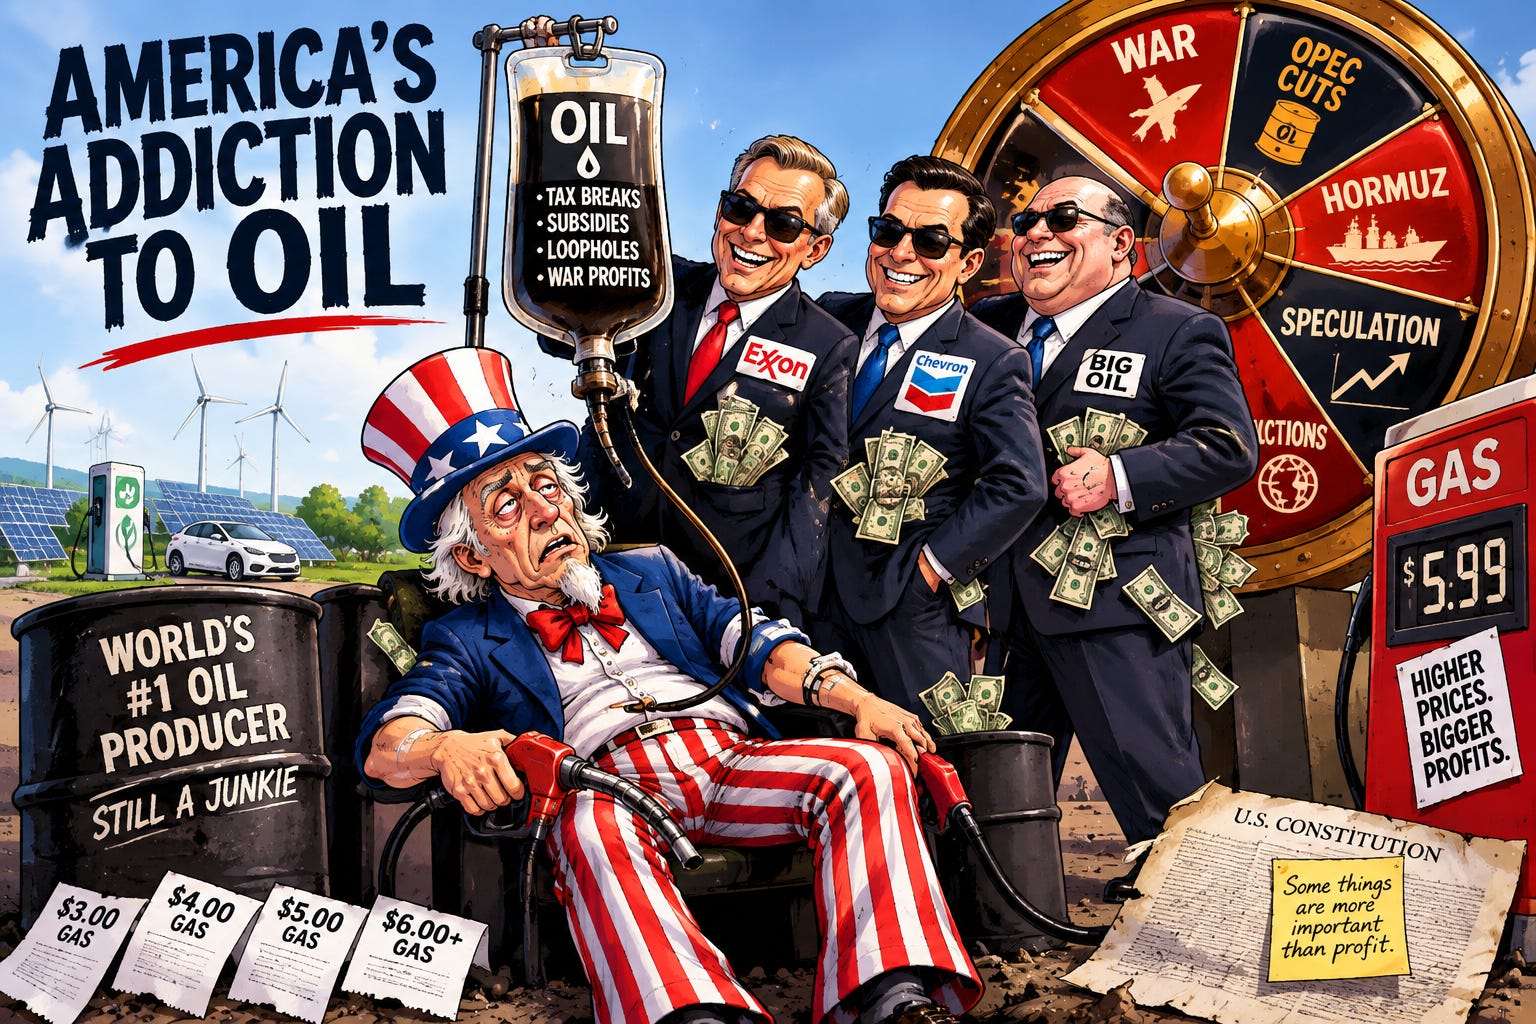
TL;DR: The United States is the largest oil producer on planet Earth, pumping up to 21 million barrels a day. Yet every time a crisis erupts halfway across the globe, everyday Americans get financially gouged at the pump. That isn’t a market paradox—it’s a feature of a rigged system. Because our refineries were built for heavy foreign crude, we export our own light shale oil and remain tied to a global cartel. While the Trump administration’s war in Iran chokes off global supply routes like the Strait of Hormuz, Western oil supermajors are pulling in record-shattering wartime profits—paying an average federal tax rate of just 6% thanks to handouts like the “One Big Beautiful Bill”. Meanwhile, federal sabotage of clean energy keeps force-feeding us expensive gas while climate disasters cost taxpayers $149 billion a year.
Welcome back to the corporate shell game that keeps us all paying at the pump.
Let’s start with a statistical reality that usually makes people’s heads spin: the United States is the single largest oil producer on planet Earth. Depending on whether you’re counting crude alone or adding natural gas liquids, we are pumping anywhere from 13.6 to 21 million barrels a day—more than Russia and Saudi Arabia combined by several metrics.
And yet, we remain perpetual buyers, not just sellers, in a global casino that runs on a commodity our own soil produces more of than anyone else.
That might look like a glaring economic contradiction, but it’s actually an addiction so total that domestic abundance hasn’t freed us from dependency. Why? Because this game was never really about supply. It has always been about who controls the supply, who profits off the volatility, and who gets stuck paying the difference when the dust settles.
Abundance Without Independence
Roughly 72% of the world’s crude oil comes from just ten countries: the U.S. (13.6 million barrels a day crude), Russia (9.9M), Saudi Arabia (9.6M), Canada (4.9M), Iraq (4.4M), China (4.3M), Iran (4.2M), the UAE (3.8M), Brazil (3.7M), and Kuwait (2.6M). A full quarter of America’s output comes from a single patch of land: the Permian Basin straddling West Texas and New Mexico.
So why doesn’t being the world’s top producer insulate us from price shocks? Because oil is sold on a single, interconnected global market.
When Saudi Arabia had to cut output from 10 to 8 million barrels a day in March 2026 because the war with Iran effectively shut down shipping through the Strait of Hormuz—a tight maritime chokepoint that carries roughly a fifth of the entire world’s petroleum—the economic shockwaves traveled straight to your local gas pump in Ohio. It didn’t matter that American rigs were drilling at maximum capacity. We produce enough oil to be untouchable, yet we are completely vulnerable. That gap is your first clue that something other than domestic supply is running this country.
GLOBAL CRUDE OIL PRODUCTION (Barrels/Day)
United States: 13.6 Million
Russia: 9.9 Million
Saudi Arabia: 9.6 Million
Canada: 4.9 Million
Iraq: 4.4 Million
The Refining Scam: Exporting Light, Importing Heavy
Not all crude oil is created equal. Understanding the difference exposes one of the dirtiest structural absurdities in American energy: we are simultaneously one of the world’s top oil exporters and one of its top importers.
Crude is graded on two simple metrics: density (API gravity, ranging from light to heavy) and sulfur content (sweet to sour).
· Light, Sweet Crude: (Like West Texas Intermediate or Bakken shale) Flowing out of American soil, this is the easiest, cleanest, and cheapest crude to refine into gasoline, diesel, and jet fuel. It commands top dollar on the market.
· Heavy, Sour Crude: (Like Venezuela’s sludge, Canada’s tar sands, or Mexico’s Maya fields) Thicker, dirtier, and vastly more expensive to process unless a refinery has specialized, multi-billion-dollar conversion equipment.
Here is the twist: about 70% of American refining capacity was constructed decades ago specifically to process that heavy, dirty, imported foreign crude—not the light shale oil booming out of Texas today.
So what do we do? We export massive quantities of our pristine domestic light crude to overseas refineries built for it, while importing heavy crude from Canada and elsewhere to feed our domestic facilities. The result is a nation that drills more oil than any empire in human history, yet still can’t fuel its own vehicles without foreign imports. It’s a permanent structural absurdity locked in by legacy infrastructure that no wealthy executive has any incentive to fix.
Who Really Controls the Tap?
The corporate entities perched atop this system fall into two distinct categories that media outlets rarely bother to differentiate:
State-Owned Giants: National oil companies that answer to autocrats, not shareholders. Saudi Aramco alone is valued at roughly $1.8 trillion—more than the next five largest private oil majors combined. Rounding out the list are China’s CNPC/PetroChina and Sinopec, Russia’s Gazprom, QatarEnergy, and Brazil’s Petrobras. Most don’t even publish audited income statements.
Western Supermajors: Publicly traded conglomerates headquartered in nations that love to lecture the developing world about “free market capitalism.” You have ExxonMobil ($637B market cap, $333.7B in 2025 revenue), Chevron ($380B market cap), Shell, BP, and TotalEnergies.
For our purposes, the Big Three American cartel bosses that matter most are ExxonMobil, Chevron, and ConocoPhillips.
Two Casinos and a Cartel
How does the world actually trade this stuff? Picture two parallel casinos operating at the exact same time, both placing bets on the exact same barrel of oil.
The first is the “Paper” Market. These are futures contracts traded on exchanges in London (ICE, trading Brent crude which prices roughly two-thirds of global oil) and New York (NYMEX, trading WTI through a storage hub in Cushing, Oklahoma). Millions of paper contracts change hands every single day between Wall Street speculators who will never touch a physical drop of oil in their lives.
The second is the “Physical” Market. These are real-world cargoes on actual tankers, negotiated directly between producers, refiners, and a shadowy collective of massive commodity trading houses most Americans have never heard of: Vitol, Glencore, Trafigura, Mercuria, and Gunvor. Prices here are set using daily assessment metrics from agencies like S&P Global Platts and Argus.
Looming over both of these casinos is OPEC+—a 24-nation cartel controlling roughly 59% of global oil production. Their backroom decisions can spike global gas prices before a single tanker leaves port. This is the financial machinery that decided a war halfway across the globe should determine whether an American family can afford to fill up their truck in Ohio.
Profiteering Off the Flames of War
In 2025, oil prices softened slightly. ExxonMobil pulled in a modest $28.8 billion, and Chevron managed $12.3 billion. But then Trump’s war with Iran changed the game overnight.
As military conflict choked off shipping through the Strait of Hormuz and Brent crude spiked past $104 a barrel, Big Oil hit the jackpot:
· ExxonMobil (Q2 2026): Raked in $14.5 billion in a single quarter—roughly $160 million in pure profit every single day.
· Chevron (Q2 2026): Posted the single largest quarterly profit in its corporate history: $12.1 billion, representing a staggering ~400% jump from the previous year.
· The Big Picture: The five Western supermajors pulled in $48 billion in three months, while six major global producers combined made $79.4 billion.
Exxon’s stock is up 51% over the past year; Chevron’s is up 27%. Things got so egregiously out of hand that even Donald Trump—standing at a podium in front of press reporters—admitted that Exxon and Chevron were making “too much money” off the war crisis and should give some back. Think about that: the President of the United States publicly conceded that oil corporations are profiteering off a war created by his own foreign policy decisions.
Q2 2026 WAR-PROFITEERING WINDFALL
Six Major Global Oil Companies Combined: $79.4 Billion
ExxonMobil (Single Quarter): $14.5 Billion
Chevron (Single Quarter): $12.1 Billion
The 6% Tax Club
You might assume that record-breaking, war-fueled profits would translate into a massive tax windfall for the American public. You’d be dead wrong.
Despite generating a combined $23 billion in domestic profit in 2025, Chevron, ConocoPhillips, and Exxon paid an average effective federal tax rate of just 6%—less than a third of the statutory 21% corporate rate.
Exxon paid five times more in taxes to the United Arab Emirates than it paid to the United States Treasury.
Chevron paid roughly three times more tax each to Kazakhstan, Nigeria, and Saudi Arabia than it did to its home government.
This isn’t an accident; it’s by design. In 2025 alone, 88 major American corporations paid $0 in federal income tax—a corporate giveaway directly traceable to the 2017 tax cuts and reinforced by Trump’s “One Big Beautiful Bill”. The pattern repeats endlessly: record profits, record windfalls, and a tax obligation that shrinks every time the cash register rings.
Executive Pay: War Pays Very Well
While working families take out loans to cover basic living expenses, executive suites are swimming in cash:
Darren Woods (ExxonMobil CEO): Took home $33 million in 2025 (down from $44.1 million in 2024), representing a pay ratio 275 times his median employee’s compensation. His base salary alone jumped to $2.14 million in 2026.
Mike Wirth (Chevron CEO): Pocketed $26.8 million in 2025 (down from $32.7 million in 2024), sitting at 175 times his median worker’s salary.
Those executive compensation numbers only dropped temporarily because 2025 profits were lower than 2024’s record highs. The war-fueled windfall of 2026 hasn’t even hit their formal compensation packages yet—but when it does, expect pay raises that could fund a small city.
Subsidies: The Hidden Tax on Breathing
There are two honest ways to calculate what the fossil fuel industry costs American taxpayers, and the gap between them tells you everything you need to know about corporate welfare.
1. The Narrow Measure (Direct Handouts)
This counts direct federal subsidies, tax loopholes, cheap lease access on public lands, and public cleanup costs. According to Oil Change International, this totals about $35 billion a year—with the “One Big Beautiful Bill” adding more than $4 billion in new carve-outs on top.
Two of these loopholes are literally older than the interstate highway system:
Intangible Drilling Cost Deduction: Dates back to 1913.
Percentage Depletion Allowance (27.5%): Dates back to 1926.
Repealing just the drilling cost deduction would return an estimated $13 billion to taxpayers over a decade.
2. The Broad Measure (The IMF Accounting)
This approach adds in the real-world costs Big Oil externalizes onto the public: asthma, respiratory illness, flooded neighborhoods, wildfire smoke, and a rapidly heating planet. On this ledger, the actual cost of fossil fuel addiction balloons to roughly $760 billion every single year.
Industry lobbyists cry foul, claiming these are merely “implicit costs” rather than direct government checks. But somebody is paying that $760 billion bill every single year—it’s just not the oil executives selling the fuel.
Sabotaging Clean Energy to Force-Feed Gas
Since taking office, the Trump administration has waged an all-out crusade against renewable energy:
· Froze all offshore wind leasing on day one.
· Canceled $679 million in offshore wind development funds.
· Terminated a 6.2-gigawatt solar initiative in Nevada capable of powering 2 million homes.
· Killed the residential solar tax credit entirely as of December 31, 2025.
· Stripped tax credits from any wind or solar project that hadn’t broken ground by July 4, 2026.
Yet clean energy keeps growing anyway: a record 79.7 gigawatts of new clean capacity is projected online in 2026, federal courts have slapped down the administration in every offshore wind case that’s reached a verdict, and consumer spending on rooftop solar, batteries, and EVs jumped 45% in a single quarter.
When direct policy sabotage failed to kill clean power, Trump’s Iran war stepped in to do the job. By driving up global energy volatility, the crisis pushed planned new natural gas capacity from 44.8 to 65.5 gigawatts in a single quarter—tripling fossil fuels’ share of all planned power generation since 2022. Because he couldn’t kill renewables outright, his foreign policy force-fed the country gas instead.
The Real Math: Levelized Energy Costs
According to Lazard’s 2026 unsubsidized energy analysis, building new power capacity breaks down like this per megawatt-hour:
Onshore Wind: $37 – $99
Utility-Scale Solar: $40 – $98
Gas Combined-Cycle: $51 – $129
Offshore Wind: $105 – $167
Gas Peaking Plants: $144 – $276
New Nuclear: $175 – $255
Renewables remain the cheapest source of new power on the planet.
To be fair, critics correctly point out that fully paid-off, legacy gas plants ($32–$51) and old nuclear plants ($26–$36) have lower immediate operating costs than building brand-new solar fields. But that narrow comparison ignores the unpaid bill at the end: unmonitored methane leaks (a greenhouse gas dozens of times more potent than CO2) and nuclear decommissioning costs that run into the billions per plant while leaving radioactive waste that lasts for millennia. When you factor in the cleanup, fossil fuel’s “efficiency” is just an unpaid credit card bill coming due later.
What True Energy Freedom Looks Like
America has 132.5 million households, 89.5 million of which are owner-occupied, including 74.3 million single-family detached homes with their own roofs.
Putting a modest 7.5-kilowatt solar system on every single home in America—at current retail prices of $2.60 to $2.75 a watt—would cost about $2.7 trillion. Under a national bulk-purchasing program negotiated at $2.00 a watt, that price drops to $2 trillion.
Spread over ten years, that comes out to $200 to $350 billion annually for a decentralized grid that generates virtually free electricity for 25-plus years. And the 43 million households who rent aren’t left behind: community solar grids and balcony solar programs (already deployed across Europe and some US cities) mean renters don’t need to own a roof to own their power supply.
10-YEAR COST COMPARISON (In Trillions)
· Full Fossil Fuel Climate & Health Cost: $7.6 Trillion
· National Rooftop Solar Infrastructure: $2.0 Trillion
· Direct Fossil Fuel Handouts: $350 Billion
Compare that $2 trillion solar cost to what we give fossil fuels over the exact same decade: $350 billion in direct subsidies, or a staggering $7.6 trillion under full-cost accounting. Democratizing power across every rooftop in America would cost a fraction of what we hand to Big Oil for the privilege of destroying the climate.
The Bill Is Arriving
Whether we plan for it or not, the full accounting is already catching up to us.
In 2025, extreme weather and climate disasters cost the United States $115 billion—the third-highest annual total on record, trailing only 2023 and 2024. America now experiences a billion-dollar weather disaster roughly once every 10 days, down from once every 82 days in the 1980s. The 5-year average disaster cost has quadrupled, jumping from $22 billion annually to $149 billion a year.
And how did the Trump administration handle this alarming reality? By abruptly killing NOAA’s billion-dollar disaster tracking database in May 2025—erasing the federal government’s primary tool for measuring these rising costs. The non-profit organization Climate Central had to step in to keep the tracking alive because the data was “simply too important to stop updating”.
We are trapped in a system we didn’t choose, that doesn’t benefit average working families, and that leaves us beholden to foreign autocrats and war-profiteering corporations. We are literally paying multi-billion-dollar conglomerates for the privilege of destroying our own planet—and then paying out of pocket for the cleanup. The real price of our addiction to oil doesn’t show up on your gas station receipt, but make no mistake: we will be paying for every last drop.
Join the Resistance!
Like, Share, and Subscribe— before solar power becomes illegal!
Follow my work:
Substack: democracy4sale.substack.com
Web: democracy4sale.com
Facebook: facebook.com/democracy4sale/
YouTube: youtube.com/democracy4sale/
Twitter/X & Bluesky
Rob Cain is the author of “Democracy for Sale: How Corporate Greed Is Corrupting Democracy and Endangering the Planet,” and writes “Our Broken Systems” at democracy4sale.com.